TYPES OF DATA ANALYTICS
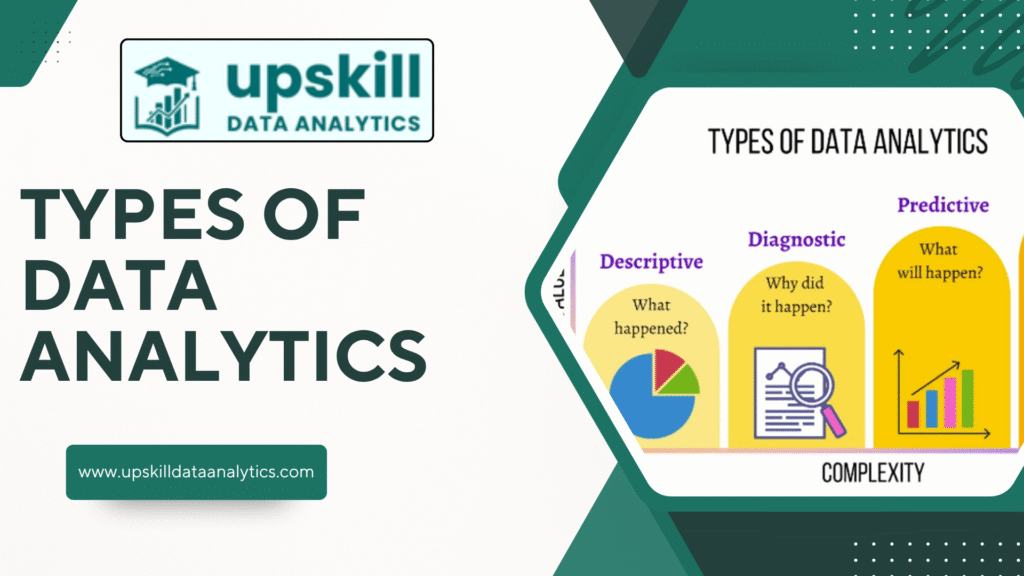
When we talk about Types of Data Analytics, we usually classify them into four major categories: Descriptive Analytics, Diagnostic Analytics, Predictive Analytics, and Prescriptive Analytics. Each serves a unique purpose, but together, they provide a complete framework for understanding data and making informed decisions.
Introduction to Data Analytics
What is Data Analytics?
Data is the backbone of the modern digital world, and the ability to make sense of it defines the success of individuals, businesses, and entire industries. Data Analytics refers to the systematic process of examining datasets to uncover meaningful insights, trends, and patterns that can guide better decision-making. In simple words, it transforms raw numbers into actionable intelligence.
Every organization today generates massive amounts of information — from customer transactions to social media interactions. Without a structured method to analyze and interpret these records, valuable opportunities for growth may be lost. That is where Types of Data Analytics come into play, giving businesses clarity on what happened, why it happened, what might happen, and what should be done.
Why is Data Analytics Important in Today’s World?
The importance of Data Analytics has grown exponentially due to digital transformation. Governments rely on it for policy-making, healthcare organizations use it for patient treatment predictions, and businesses employ it to understand consumer behavior. By implementing the right Types of Data Analytics, organizations can:
Increase efficiency and reduce costs.
Understand customer needs in real time.
Detect fraud and anomalies.
Create personalized products and services.
Build data-driven strategies for long-term growth.
For individuals, learning Data Analytics opens the door to a fast-growing career. Specialized programs such as a Data Analytics Course in Hyderabad prepare students and professionals with skills in SQL, Python, Tableau, and Power BI, ensuring they are job-ready in the evolving analytics industry.
Evolution of Data Analytics – From Basic Reports to AI-Driven Insights
The journey of Types of Data Analytics has been fascinating. In the early 1990s, organizations relied on static reports and spreadsheets to understand historical performance. This was useful but limited. By the 2000s, Business Intelligence (BI) tools emerged, making dashboards and interactive reports a reality.
Fast forward to today, Data Analytics leverages Artificial Intelligence (AI), Machine Learning (ML), and Big Data technologies. Now, companies don’t just look at what happened — they can predict what is likely to happen and receive recommendations on the best actions to take. This evolution shows why Types of Data Analytics is not just a buzzword but a critical component of modern business.
Data Analytics in Daily Life
Most people don’t realize that they already interact with Data Analytics every day. For example:
Netflix recommends movies by analyzing your past viewing patterns.
Banks use analytics to detect unusual transactions and prevent fraud.
E-commerce websites suggest products based on browsing and purchase history.
Fitness apps track user activity and provide insights into health and progress.
This shows how the Types of Data Analytics influence decision-making at both organizational and individual levels.
Career Demand for Data Analytics
The global market for Data Analytics is expected to surpass $300 billion by 2030, and India is a key contributor to this growth. Hyderabad, often called the Silicon Valley of India, is home to leading IT companies and MNCs, making it a prime location for analytics jobs. A structured Data Analytics Course in Hyderabad equips learners with industry-ready skills, internships, and placement support.
With roles such as Data Analyst, Business Analyst, Data Engineer, and Data Scientist in high demand, mastering the Types of Data Analytics ensures professionals stay ahead in a competitive market.
The Importance of Data Analytics in Business
9The world is moving toward a data-driven future. Companies that embrace Types of Data Analytics gain an unmatched edge over competitors because decisions are no longer based on assumptions — they’re grounded in facts, numbers, and actionable insights. Let’s explore why Data Analytics has become the heartbeat of modern businesses.
Driving Informed Decision-Making
In the past, leaders often relied on instinct or experience to make critical decisions. Today, thanks to different Types of Data Analytics, companies base their strategies on concrete evidence.
Example: A retail chain analyzing buying patterns before launching a new product line.
Impact: Reduced risks, improved customer satisfaction, and higher profitability.
By mastering these processes through a Data Analytics Course in Hyderabad, professionals can become the decision-makers that organizations rely on.
Enhancing Customer Understanding
Customers are the lifeline of any business, and their behavior changes rapidly. With Descriptive and Diagnostic Analytics, organizations can monitor how customers interact with their products. With Predictive and Prescriptive Analytics, they can anticipate needs and design better experiences.
Example: An online food delivery company uses analytics to predict meal preferences in different regions.
Impact: Personalized marketing campaigns and stronger customer loyalty.
Achieving Operational Efficiency
Businesses lose millions due to inefficiencies. Types of Data Analytics help reduce costs, optimize processes, and boost productivity.
Example: Airlines use predictive analytics to maintain engines before failure occurs, saving millions in repairs.
Impact: Improved efficiency, fewer delays, and enhanced safety.
Gaining Competitive Advantage
In crowded markets, speed and accuracy matter. Companies that utilize advanced Types of Data Analytics can adapt faster than competitors.
Example: E-commerce giants like Amazon analyze customer data in real time to provide recommendations.
Impact: Higher sales, customer retention, and market dominance.
This is why professionals equipped with skills from a Data Analytics Course in Hyderabad are highly sought-after — they can help companies outperform competitors.
Real-World Industry Applications
Banking & Finance: Fraud detection, credit risk analysis, and algorithmic trading.
Healthcare: Predicting patient readmissions, personalized treatment plans.
Retail: Inventory management, sales forecasting, demand analysis.
Telecom: Customer churn analysis, network optimization.
Education: Tracking student performance and personalizing learning paths.
Across industries, Types of Data Analytics deliver measurable business results.
Future of Data Analytics in Business
The rise of Artificial Intelligence (AI), Machine Learning (ML), and Big Data means that analytics is evolving faster than ever. Soon, businesses will use real-time prescriptive models that don’t just suggest solutions but automate actions.
For career aspirants, this means now is the best time to enrol in a Data Analytics Course in Hyderabad, where training covers not only fundamental analytics but also modern AI-driven approaches.
Descriptive Analytics: An Overview
Among the four main Types of Data Analytics, Descriptive Analytics is often seen as the entry point. It helps organizations answer the most basic yet powerful question: “What happened?” By summarizing historical data into understandable reports, dashboards, and KPIs, businesses gain a clear picture of past performance and can prepare for smarter strategies.
What is Descriptive Analytics?
Descriptive Analytics focuses on analyzing past data to provide insights into trends, patterns, and outcomes. It doesn’t predict the future or explain causes — it simply tells the story of what has already occurred.
Example: A company reviewing sales performance over the last quarter to measure growth.
Output: Monthly reports, charts, and dashboards.
This makes Descriptive Analytics the most widely used of all Types of Data Analytics because it’s essential for reporting and performance measurement.
Key Features of Descriptive Analytics
Data Aggregation – Collecting data from multiple sources like CRM systems, e-commerce platforms, and ERP tools.
Data Summarization – Converting raw figures into charts, graphs, and tables.
Performance Indicators – Using KPIs (Key Performance Indicators) to measure progress.
Visual Representation – Dashboards in Power BI or Tableau make data easy to understand.
By learning these skills in a Data Analytics Course in Hyderabad, students can immediately apply them in roles such as business analyst or reporting specialist.
Tools Used in Descriptive Analytics
Microsoft Excel: Still widely used for basic data reporting.
Power BI & Tableau: For interactive dashboards and visual insights.
SQL: To query large datasets effectively.
Google Analytics: For analyzing website traffic and performance.
These tools help professionals create meaningful reports that guide business decisions.
Business Applications of Descriptive Analytics
Retail: Identifying which products sold the most during festive seasons.
Healthcare: Tracking the number of patients treated monthly.
Education: Analyzing student performance data to find learning gaps.
Finance: Summarizing quarterly profits and losses for shareholders.
Each of these examples proves how Descriptive Analytics supports evidence-based decision-making.
Benefits of Descriptive Analytics
Provides clarity on past performance.
Helps track progress against business goals.
Makes reporting transparent and consistent.
Acts as the foundation for deeper analytics like diagnostic and predictive.
Limitations of Descriptive Analytics
While Descriptive Analytics is powerful, it has limitations:
It cannot explain why something happened.
It cannot predict future outcomes.
It is reactive rather than proactive.
That’s why businesses use Descriptive Analytics as the first step before moving on to advanced Types of Data Analytics like diagnostic and predictive.
Diagnostic Analytics: Understanding Causes
While Descriptive Analytics tells us what happened, Diagnostic Analytics answers the more critical question: “Why did it happen?” It digs deeper into the data to reveal patterns, connections, and the real reasons behind events.. This makes Diagnostic Analytics one of the most valuable Types of Data Analytics for organizations aiming to improve decision-making and problem-solving.
What is Diagnostic Analytics?
Diagnostic Analytics involves examining data in detail to identify causal relationships and patterns. Unlike descriptive methods, it doesn’t just show outcomes — it explains the reasons behind them.
Example: A retail store noticing a sales drop in Q2 and analyzing customer demographics, seasonal effects, and competitor activity to identify the root cause.
Output: Insights into “why sales decreased” rather than simply “sales decreased.”
For learners taking a Data Analytics Course in Hyderabad, mastering Diagnostic Analytics provides the ability to go beyond surface-level reporting into deeper business intelligence.
Key Techniques of Diagnostic Analytics
Drill-Down Analysis – Exploring data layer by layer (e.g., monthly sales → region → product → store).
Data Discovery – Identifying patterns and anomalies through interactive dashboards.
Correlation Analysis – Understanding relationships between variables (e.g., marketing spend vs. sales).
Root Cause Analysis – Tracing performance issues back to the underlying problem.
Tools for Diagnostic Analytics
SQL & Python: For data queries and statistical analysis.
R Programming: For advanced correlation and causation models.
Tableau/Power BI: To drill down into data visually.
Machine Learning Models: For pattern recognition and anomaly detection.
Business Applications of Diagnostic Analytics
Banking & Finance: Identifying why loan defaults are rising.
Healthcare: Investigating why patient readmissions are increasing.
Telecom: Finding causes behind high customer churn.
E-commerce: Understanding why cart abandonment rates are high.
Each case highlights how Diagnostic Analytics helps organizations solve real problems.
Benefits of Diagnostic Analytics
Provides clarity on underlying causes.
Improves decision-making by addressing root problems.
Helps businesses identify strengths and weaknesses.
Prepares organizations for predictive modeling.
Limitations of Diagnostic Analytics
Requires high-quality, detailed data.
Can be time-consuming and resource-intensive.
Doesn’t guarantee predictions — only explains past causes.
That’s why organizations often combine Diagnostic with Predictive and Prescriptive analytics to complete the Types of Data Analytics cycle.
Predictive Analytics – Forecasting the Future
Among all Types of Data Analytics, Predictive Analytics stands out as the bridge between past data and future insights. While Descriptive tells us what happened and Diagnostic explains why it happened, Predictive Analytics helps organizations answer: “What is likely to happen next?”
By using statistical algorithms, historical data, and machine learning models, businesses can forecast outcomes with a high degree of accuracy.
What is Predictive Analytics?
Predictive Analytics is the science of analyzing historical trends and applying models to make predictions about the future. It doesn’t guarantee outcomes but provides a probabilistic view of what may occur.
Example: An online streaming platform predicting which movies a user will watch next.
Output: Forecasts, risk scores, and demand predictions.
For professionals in a Data Analytics Course in Hyderabad, learning Predictive Analytics means gaining expertise in advanced tools and algorithms that are in high demand globally.
Core Techniques of Predictive Analytics
Regression Analysis – Understanding the relationship between dependent and independent variables (e.g., how marketing spend affects sales).
Decision Trees – Splitting data into categories for prediction.
Clustering Models – Grouping customers based on similarities for targeted marketing.
Neural Networks – Using AI-based methods to recognize complex patterns.
Time-Series Forecasting – Predicting values based on past trends (e.g., stock market prices).
Tools and Technologies in Predictive Analytics
Python & R: Popular languages for statistical modeling.
Scikit-Learn, TensorFlow, PyTorch: For building machine learning models.
Power BI & Tableau: To visualize predictions.
Big Data Tools: Hadoop, Spark for handling massive datasets.
Business Applications of Predictive Analytics
Banking & Finance: Predicting loan defaults, credit scoring, fraud detection.
Retail: Forecasting inventory demand during seasonal sales.
Healthcare: Predicting disease risks or patient readmission probabilities.
Marketing: Identifying potential leads and personalizing campaigns.
Manufacturing: Anticipating machine breakdowns for preventive maintenance.
These applications show why Predictive Analytics has become a cornerstone in the evolution of Types of Data Analytics.
Benefits of Predictive Analytics
Improves decision-making with forward-looking insights.
Minimizes risks by identifying future challenges early.
Enhances customer experiences through personalization.
Increases efficiency with smarter forecasting.
Challenges and Limitations
Requires large volumes of clean, high-quality data.
Models may be biased if data isn’t diverse or accurate.
Predictions are probabilities, not certainties.
Despite these challenges, organizations heavily invest in Predictive Analytics because it unlocks tremendous business value.
Career Scope in Predictive Analytics
Predictive Analytics is one of the hottest skills in the job market. Roles such as Data Scientist, Predictive Modeler, and AI Engineer are built around these concepts. By enrolling in a Data Analytics Course in Hyderabad, learners can gain the technical know-how to work with predictive models and secure placements in top MNCs.
Prescriptive Analytics – Recommending the Best Actions
While Descriptive Analytics tells us what happened, Diagnostic explains why it happened, and Predictive shows what might happen in the future, Prescriptive Analytics goes a step further. It answers the most crucial business question: “What should we do about it?”
This makes Prescriptive Analytics the most action-oriented among all Types of Data Analytics, as it not only forecasts but also recommends solutions for achieving optimal outcomes.
What is Prescriptive Analytics?
Prescriptive Analytics is the process of using data, mathematical models, and AI-driven algorithms to suggest the best course of action. Instead of leaving decision-making entirely to humans, it guides or automates decisions by analyzing multiple possibilities.
Example: A logistics company using prescriptive models to find the cheapest, fastest, and safest delivery routes.
Output: Recommendations, action plans, and optimized strategies.
For professionals who enroll in a Data Analytics Course in Hyderabad, learning Prescriptive Analytics means preparing for roles where data-driven strategies directly shape organizational growth.
Core Techniques in Prescriptive Analytics
Optimization Models – Finding the best solution from multiple options (e.g., resource allocation).
Simulation Models – Testing “what-if” scenarios to evaluate outcomes.
Machine Learning Algorithms – Automating recommendations using historical data.
Decision Analysis – Evaluating trade-offs and risks for better outcomes.
Tools and Technologies for Prescriptive Analytics
IBM Decision Optimization
Google OR-Tools
SAS Advanced Analytics
Python Libraries (SciPy, PuLP, Pyomo)
Simulation Platforms like AnyLogic
These tools help businesses transform raw data into actionable strategies.
Business Applications of Prescriptive Analytics
Retail: Dynamic pricing strategies to maximize profits.
Healthcare: Suggesting the best treatment plan for patients based on historical outcomes.
Banking & Finance: Portfolio optimization and risk management.
Manufacturing: Recommending the most efficient production schedule.
Supply Chain: Choosing optimal delivery routes and warehouse strategies.
These examples highlight why Prescriptive Analytics is the most strategic and forward-looking of all Types of Data Analytics.
Benefits of Prescriptive Analytics
Turns insights into direct action.
Reduces uncertainty in decision-making.
Optimizes resources and maximizes ROI.
Automates processes for faster execution.
Challenges and Limitations
Requires complex algorithms and skilled professionals.
Heavy reliance on high-quality data.
Can be difficult for organizations without strong IT infrastructure.
However, companies that adopt Prescriptive Analytics gain a massive competitive advantage in their industries.
Career Opportunities in Prescriptive Analytics
Since Prescriptive Analytics combines optimization, AI, and decision science, it creates demand for high-level roles:
Decision Scientist
Optimization Specialist
AI Consultant
Data Scientist with Prescriptive Modeling skills
This is why enrolling in a Data Analytics Course in Hyderabad can help professionals not just learn analytics basics but also specialize in advanced Prescriptive Analytics for high-paying roles.
Tools and Technologies Used in Data Analytics
To apply the different Types of Data Analytics effectively, professionals rely on specialized tools and technologies. These platforms allow them to collect, clean, analyze, visualize, and interpret data at scale. Whether you’re learning through a Data Analytics Course in Hyderabad or working in a global MNC, mastering these tools is essential for building a successful analytics career.
Programming Languages for Data Analytics
Python
Most popular language for Data Analytics.
Rich ecosystem with libraries like Pandas, NumPy, Matplotlib, Scikit-Learn, and TensorFlow.
Used in predictive and prescriptive analytics.
R
Widely used for statistical computing and data visualization.
Best suited for Descriptive and Diagnostic Analytics.
Packages like ggplot2 and dplyr simplify reporting and analysis.
SQL (Structured Query Language)
The backbone of data querying and relational database management.
Essential for extracting and cleaning data before applying analytics.
Data Visualization Tools
Tableau – Popular for interactive dashboards and storytelling with data.
Power BI – Microsoft’s business analytics tool widely used in enterprises.
Google Data Studio – Cloud-based visualization tool for marketers and small businesses.
Visualization is especially important in Descriptive Analytics, where managers need to quickly understand what the data is saying.
Big Data Tools
Hadoop –A free and open framework designed to handle both data storage and large-scale processing.
Apache Spark – Faster and more advanced than Hadoop, widely used in large-scale analytics.
Kafka – For real-time data streaming and processing.
These tools support Predictive and Prescriptive Analytics, especially when handling massive datasets.
Cloud Platforms
Google Cloud (BigQuery, Vertex AI) – For large-scale analytics and machine learning.
AWS (Amazon Web Services) – Offers Redshift, SageMaker, and QuickSight for end-to-end analytics.
Microsoft Azure – Provides Synapse Analytics, Azure Machine Learning, and Power BI integration.
Cloud platforms are now integral to modern Types of Data Analytics, enabling scalable and cost-efficient solutions.
Specialized Analytics Tools
SAS Analytics – Advanced statistical analysis, widely used in finance and healthcare.
MATLAB – Useful for mathematical modeling and simulation.
RapidMiner – Drag-and-drop platform for predictive analytics.
Why Mastering These Tools Matters
Employers across industries look for professionals who not only understand the Types of Data Analytics but also have hands-on experience with these tools. A well-structured Data Analytics Course in Hyderabad ensures that learners:
Practice on real-world projects.
Gain exposure to multiple platforms.
Become job-ready for roles such as Data Analyst, Business Analyst, and Data Scientist.
Career in Data Analytics
As organizations continue to adopt digital transformation, the demand for professionals skilled in different Types of Data Analytics is skyrocketing. Companies no longer make decisions purely on intuition — they rely on data-driven insights. This shift has created thousands of high-paying jobs in analytics across industries such as IT, healthcare, banking, retail, and telecom.
For aspiring professionals, pursuing a Data Analytics Course in Hyderabad is a direct pathway to entering this booming job market. Hyderabad, being one of India’s largest IT hubs, hosts multinational corporations and startups that are constantly on the lookout for analytics talent.
Popular Job Roles in Data Analytics
Data Analyst
Role: Collecting, cleaning, and analyzing data to generate reports and dashboards.
Skills: SQL, Excel, Python, Tableau/Power BI.
Average Salary in India: ₹5–8 LPA; in Hyderabad, ranges between ₹6–10 LPA.
Business Analyst
Role: Bridging the gap between data teams and business stakeholders.
Skills: Requirement gathering, visualization tools, domain expertise.
Salary Range: ₹6–12 LPA.
Data Scientist
Role: Building predictive models using machine learning and AI.
Skills: Python, R, TensorFlow, advanced statistics.
Salary Range: ₹10–20 LPA; Hyderabad has top opportunities in this domain.
Data Engineer
Role: Designing pipelines to store and process data efficiently.
Skills: Hadoop, Spark, Kafka, SQL, Cloud Platforms.
Salary Range: ₹8–15 LPA.
Machine Learning Engineer
Role: Implementing predictive and prescriptive models.
Skills: Python, PyTorch, TensorFlow, cloud deployment.
Salary Range: ₹12–20 LPA.
Industries Hiring Data Analytics Professionals
IT and Software – For digital transformation projects.
Banking & Finance – Fraud detection, credit risk, and algorithmic trading.
Healthcare – Predictive treatment and operational optimization.
Retail & E-commerce – Customer segmentation and recommendation systems.
Telecom – Churn analysis, customer experience, and network optimization.
These industries all rely on the four Types of Data Analytics (Descriptive, Diagnostic, Predictive, Prescriptive) to stay competitive.
Why Hyderabad is a Hotspot for Data Analytics Careers
Hyderabad has become India’s analytics hub because:
It hosts IT giants like Microsoft, Amazon, Deloitte, Infosys, and TCS.
The city has a thriving startup ecosystem.
Salaries are competitive with lower living costs compared to Bengaluru.
Multiple institutes offer a Data Analytics Course in Hyderabad with placement support.
This combination makes Hyderabad one of the best places to start or transition into a career in analytics.
Career Growth Path in Data Analytics
Entry-Level (0–2 years): Data Analyst / Junior Business Analyst.
Mid-Level (3–6 years): Business Analyst / Data Engineer.
Senior-Level (7+ years): Data Scientist / Analytics Manager / AI Consultant.
With experience and specialization in Types of Data Analytics, professionals can even move into leadership roles such as Chief Data Officer (CDO).
How a Data Analytics Course in Hyderabad Helps
Enrolling in a professional training program provides:
Hands-on experience with tools like SQL, Python, Tableau, Power BI.
Real-world projects based on Types of Data Analytics.
Resume and interview preparation.
100% placement assistance with MNCs.
This ensures learners don’t just gain knowledge but also secure career opportunities.
Conclusion
The world today thrives on data, and businesses that fail to embrace analytics risk falling behind. By leveraging the Types of Data Analytics — Descriptive, Diagnostic, Predictive, and Prescriptive — organizations can understand past events, uncover causes, predict future outcomes, and take the best course of action.
From healthcare to retail, banking to telecom, every industry now depends on analytics to make smarter decisions. For individuals, this shift creates a golden opportunity. Building expertise in the Types of Data Analytics not only makes you more employable but also opens the door to high-paying global careers.
If you’re looking to start your journey, enrolling in a Data Analytics Course in Hyderabad equips you with practical skills, tools, and placement support to step confidently into the world of data. Remember, the future belongs to those who can turn information into action — and mastering Data Analytics is the best way to get there.
FAQs
What are the four main Types of Data Analytics?
The four main Types of Data Analytics are Descriptive (what happened), Diagnostic (why it happened), Predictive (what might happen), and Prescriptive (what should be done).
Why are the Types of Data Analytics important in business?
They help businesses gain insights, identify root causes, forecast future trends, and recommend the best actions — leading to smarter decision-making and higher efficiency.
What is the difference between Descriptive and Diagnostic Analytics?
Descriptive Analytics summarizes past data (e.g., sales dashboards).
Diagnostic Analytics explains why events occurred (e.g., root cause of sales decline).
How does Predictive Analytics help organizations?
Predictive Analytics uses historical data, AI, and statistical models to forecast future outcomes — like customer churn, sales demand, or credit risk.
Item #5What are real-world examples of Prescriptive Analytics?
Optimizing delivery routes in logistics.
Suggesting personalized treatments in healthcare.
Dynamic pricing in e-commerce.
What skills are required for a career in Data Analytics?
Skills include SQL, Python, R, Tableau, Power BI, statistics, and machine learning. Training in these areas is offered in a Data Analytics Course in Hyderabad.
Is Data Analytics a good career choice in Hyderabad?
Yes. Hyderabad is an IT hub with companies like Amazon, Microsoft, Deloitte, and TCS hiring analytics professionals. With salaries ranging from ₹6 LPA to ₹20+ LPA, pursuing a Data Analytics Course in Hyderabad is a smart investment.